Zcash is consolidating in a range that resembles the setup before its summer breakout. Analysts split on whether $1,030 to $1,050 holds as the key floor.

Zcash has pulled back from its all-time high, and the chart now looks a lot like the one that preceded its last big run. That resemblance is the bull case in a nutshell, and it's worth taking seriously even if the pattern doesn't play out.
ZEC has traded between roughly $1,200 and $1,400 for several weeks after peaking near $1,700 in late September. This week it bounced back toward $1,370, right as the NU7 network upgrade went live on mainnet.
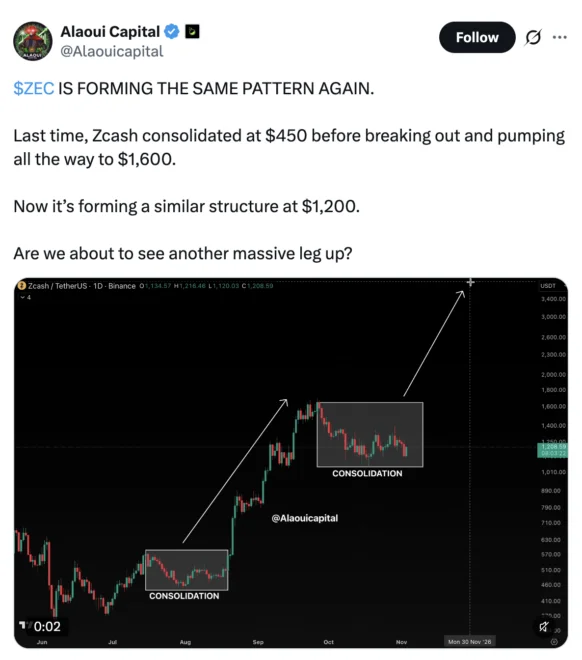
Crypto analyst Alaoui Capital argues this isn't a new pattern. In a post on X, the analyst noted that ZEC spent the summer consolidating around $450 to $480 before breaking out to its record high. The current structure, forming near $1,200, looks like a second version of that base.
The Summer Breakout Is the Template
In mid-August, ZEC was trading near $478. Within about six weeks it reached an all-time high just under $1,700, a gain of more than 250%.
The run didn't start with a spike. ZEC moved sideways in a tight box for several weeks, which shook out short-term traders while buyers accumulated. When the range finally broke, the move was fast and steep.
The difference this time is the price level. The new base sits near $1,200 rather than $450, so the same shape now carries far more dollar exposure on both sides.
An Ascending Triangle With a Clear Trigger
Analyst Ardi reads the lower timeframes differently but reaches a similar conclusion about direction. He sees an ascending triangle forming off lows near $1,050, with a rising trendline of higher lows pressing price into horizontal resistance at $1,370.
That $1,370 level has rejected ZEC repeatedly. Ardi says a decisive close above it would end his short position and open a move toward $1,500 to $1,700. If ZEC fails there again, he expects the downtrend to persist, with $1,210 and $1,100 as the next supports.
A Longer Structure Points Higher
The current setup sits inside a larger pattern that started developing earlier this year. An FX Empire analysis published on Yahoo Finance in early September pointed to an ascending triangle on the daily chart dating back to March 2026. ZEC broke above the $675 to $700 resistance zone in late August, which confirmed the pattern for that analysis.
Measuring the height of that triangle produced a long-term target of $2,500. The same analysis noted that the share of shielded ZEC had climbed to its highest level in almost two years, a sign that people are using the network's privacy features more, not just trading the token.
Two Upgrades, Two Different Jobs
Price action isn't the whole story. Zcash has shipped two significant upgrades in recent months, and they address different problems.
In late July, the network activated Ironwood, a new formally verified shielded pool. It was introduced after a vulnerability turned up in the older Orchard pool. Ironwood also added a turnstile mechanism that makes the total ZEC supply easier to audit, which matters for a privacy asset that wants to prove its own scarcity.
NU7 went live on mainnet this week. It cuts the target block time from 75 seconds to 25 seconds, so private payments confirm roughly three times faster. It also introduces a new fee mechanism meant to support network security while keeping the 21 million coin cap intact.
Development funding remains a live debate. A Zcash co-founder has called for ending the grants funding stream. Privacy coins, meanwhile, held up better than most of the market during this week's AI-driven sell-off, which is a useful data point for anyone who views ZEC as a distinct trade.
The Levels That Decide the Next Move
On the upside, $1,370 to $1,400 is the first real hurdle. Clearing it puts $1,500 to $1,700 back in play. A daily close above the all-time high near $1,700 would open the path toward the $2,500 target.
On the downside, $1,200 to $1,210 is the first support, followed by $1,100. The floor that matters most sits between $1,030 and $1,050.
That floor is where the bearish case gets specific. Some chartists see a head and shoulders forming on the daily chart, with a left shoulder near $1,300, a head near $1,700, and a right shoulder around $1,400. A daily close below $1,030 to $1,050 on rising volume would confirm that pattern. A sustained move above $1,400 would weaken it.
Analyst Crypto Patel is more blunt. He has warned of a deeper 50% to 70% correction unless ZEC closes above its $1,699 all-time high on a higher timeframe.
For now, the bigger structure favors the bulls as long as $1,030 to $1,050 holds. My read is that the next clean close above $1,370 will tell us more than any pattern drawn on a chart, and that the $1,050 floor is the level to watch if it doesn't.


Discussion
Sign in to join the discussion.