XRP has dropped 23.4% since November 4, well ahead of Bitcoin, Ether and Solana. One analyst's three-part explanation and key price levels frame what comes next.
Bitcoin, Ether and Solana have all taken hits in November's crypto sell-off. XRP, though, is getting hit much harder, and that gap is drawing questions. Crypto analyst EGRAG Crypto argues the underperformance isn't random and lays out three possible drivers. His read: the token may keep struggling while bearish sentiment holds.
I'd read this one carefully. When a sell-off hits the whole market, the explanation is usually broad: nervous traders, tighter risk appetite, a general loss of conviction. When one asset falls noticeably further than its peers, the question shifts to what's specific to that asset. Analysts who look at that kind of gap tend to start with positioning, holder behavior and market structure, which is where EGRAG goes here. That's a sensible place to start. It doesn't mean the conclusions are settled.
XRP Is Falling Faster Than the Majors
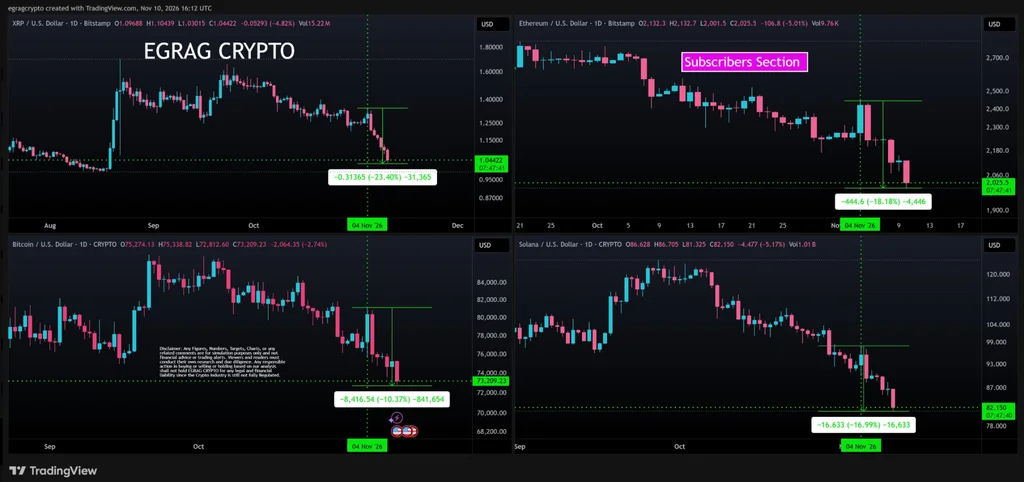
In a Nov. 10 post on X, EGRAG Crypto flagged how far XRP has pulled away from the pack since November 4. The post was short, but the point was pointed: the drawdown isn't evenly spread across the big names. Ripple's token has posted the steepest decline of the four major cryptocurrencies over that stretch, and that ranking is what kicked off the discussion.
The numbers are stark. XRP is down 23.4% since November 4, compared with a 18.2% drop for Ether and 17% for Solana. Bitcoin has held up better, shedding 10.4% over the same window. That works out to roughly 13 percentage points more damage than Bitcoin took, and about five points more than Ether. Here's the thing: a gap that size over a few weeks is hard to dismiss as noise, even if the window is short.
Context matters with a number like this. Short measurement windows can exaggerate moves, especially when the starting date happens to fall near a local high. Still, the comparison is apples to apples. All four assets were measured from the same date, so whatever happened to XRP happened against the same backdrop that hit the others.
So why is XRP bleeding so much more? EGRAG Crypto offers three possibilities, each with its own probability weighting.
Three Headwinds, Weighted Differently
The first suspect is leveraged long liquidations, which EGRAG rates at 30%. Forced closures of bullish positions, paired with thin buying demand, could be pushing XRP lower. Once leveraged traders are forced out during a downturn, their selling feeds on itself and can deepen a correction that was already underway. This is a mechanical explanation, and it's the easiest one to test: liquidation data is usually visible, so the claim can be checked against what actually happened on exchanges.
The second possibility, at 20%, is selling by early XRP holders. EGRAG suggests longtime investors, often called OGs, may be taking profits and moving capital into other coins. That kind of rotation adds supply, and it hurts more if large holders trim exposure while conditions remain shaky. Rotation is a common story in every altcoin cycle, and it's plausible here. The trouble is that profit-taking by long-term holders looks identical to distribution from anyone else on a price chart.
The heaviest weighting goes to market manipulation or a deliberate liquidity hunt, at 50%. In this scenario, sharp moves are engineered to trigger stop-losses and shake out weaker hands before any recovery. EGRAG believes this would explain why XRP is absorbing selling pressure the other majors aren't. That's the most dramatic of the three, and it's also the hardest to prove. Liquidity hunts leave traces, but so does ordinary panic, and separating the two after the fact is messy.
Worth keeping in mind: these figures are EGRAG Crypto's own probability estimates, not independently verified findings about what's driving the decline. The three weights add up to 100%, which gives the framework a tidy look. But the percentages aren't derived from data in the article, and nothing here shows how the analyst arrived at them. Treat them as a structured opinion, not a measurement.
Price Levels and the Whale Question
EGRAG also points to a few levels that could set XRP's next move. The $1.00 to $1.04 range is the zone to watch for stabilization. Holding it could give XRP a floor while selling pressure persists. Round numbers like $1.00 tend to attract attention from traders on both sides, which is partly why a break below one can accelerate selling and a hold above one can draw in dip buyers.
On the upside, bulls first need to reclaim $1.15 before aiming for $1.25. Getting back above those thresholds would suggest buying momentum is returning and might give investors some relief after recent losses. Note the order, though. Reclaiming $1.15 is the first hurdle, not the finish line, and a quick bounce that fails at that level would tell you something too.
The analyst's personal read leans toward manipulation designed to scare newer investors into selling. He also raises a bigger question about whale activity. Are deep-pocketed holders using the dip to accumulate, or are they offloading into weakness? Whale wallets are one of the more watched signals in crypto, and they're also easy to misread. A large wallet moving tokens might be an exchange, a custodian, or a single entity rebalancing, and none of those is a clear buy or sell signal on its own.
That answer may matter most. If large holders absorb the available supply, the sell-off could lose steam. If whales keep selling, the sixth-largest cryptocurrency faces a much tougher road back. (And this is the part most people overlook: a whale absorbing supply and a whale quietly exiting can look almost the same for a few days.) The difference only becomes obvious in hindsight.
What This Means If You're Tracking XRP
If you're following XRP through this stretch, the most useful thing you can do is separate the three layers of this argument. The first is the observable part: the 23.4% drop, the gap to the other majors, and the price levels. Those are checkable. The second is the attribution, which is EGRAG's theory about why the drop happened. That's where the weightings come in, and they're the weakest link. The third is the forecast, meaning whether XRP stays weak while bearish sentiment holds. That's the least certain of all.
What makes this more significant than it looks is the way it frames the next few weeks. The levels EGRAG identifies work as tests. If XRP holds the $1.00 to $1.04 zone, the manipulation thesis gets harder to sustain, because a liquidity hunt usually doesn't stop once the stops are gone. If it breaks that range and keeps falling, the liquidation or holder-selling explanations gain weight. Either outcome would tell you more than the probability estimates do.
I'd also be skeptical of any single explanation for a move like this. Crypto sell-offs rarely have one cause, and the three drivers here aren't mutually exclusive. Liquidations can accelerate a sell-off that holders started, and a manipulation attempt can exploit liquidations that were already sitting in the market. The honest read is that EGRAG has identified plausible mechanisms and assigned them confident-sounding numbers. Whether the numbers hold up is something only the subsequent price action and on-chain record can settle.
For now, the story is less about one analyst's forecast and more about a question the market hasn't answered yet. Is XRP's weakness a temporary dislocation that will look obvious in retrospect, or the start of a longer period of underperformance? Nobody reading this should treat the answer as known. Watch the levels, watch the whales, and keep your skepticism sharp.



Discussion
Sign in to join the discussion.