Wallets holding at least 1 million XRP reached 2,147, a 2026 high, while exchange reserves keep falling. Here's what the on-chain data suggests.


Large XRP holders seem to be buying into weakness while much of the crypto market is still searching for direction. The number of wallets holding substantial amounts keeps rising even as price pressure lingers, and that divergence is the part worth watching. Price alone rarely tells you who's on the other side of a trade, which is why holder counts and exchange flows deserve more attention than they usually get.
Million-Token Wallets Hit a 2026 High
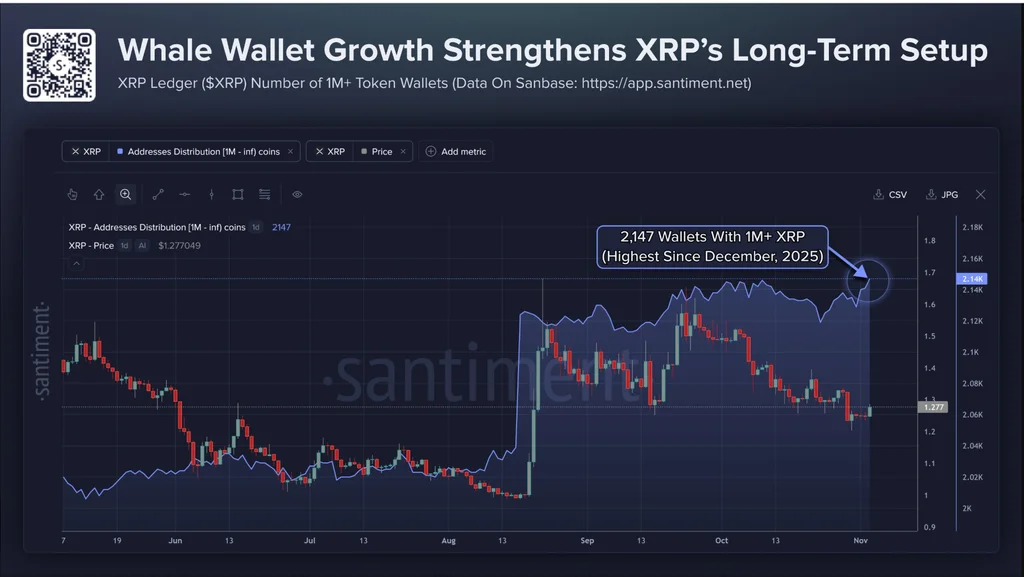
Data from Santiment shows that wallets holding at least 1 million XRP have reached 2,147, the highest count recorded this year. The pace has picked up. Twenty-eight wallets have joined that group over the past 10 days, and 18 of them arrived in the last three. Those numbers are more useful than a single price move because they track commitment rather than sentiment, and a wallet holding a million tokens isn't a casual trader.
My read is that this looks less like retreat and more like accumulation into a dip. Big holders stepping in while the price sags sends a different signal than whales heading for the exits. That distinction matters more than it sounds, because a whale selling into strength and one buying into weakness are usually reacting to different information. I'd call this more significant than it looks, though I'd stop short of calling it confirmation.
Santiment has flagged the $1.20 to $1.25 range as the key support zone. Its framework holds that the bullish setup stays intact as long as XRP defends that band and the count of 1-million-token wallets stays above 2,140. Both conditions matter. A price floor without holder growth would tell a weaker story, and so would the reverse. Here's the thing: a support level is only as reliable as the buyers defending it, and a band like this is a hypothesis until the market tests it.
Three Developments Beneath the Price
Whale accumulation isn't the only thing happening. Institutional exposure, activity on the XRP Ledger (XRPL), and falling exchange balances all point in a similar direction. None of these signals proves much alone. Taken together, they describe a token whose holders, intermediaries, and infrastructure are moving in the same general direction during a stretch of price weakness, and that's why it's worth looking at them side by side.
Start with funds. Blockworks' Q3 2026 XRP report puts net inflows into global XRP exchange-traded products at roughly $355 million for the quarter, up about 40% from the prior quarter. Assets under management climbed 65% to $3.3 billion. The 65% jump deserves a closer look, because asset growth can come from new money or from rising prices, and the two don't mean the same thing. Fund wrappers give traditional investors a way in without opening a crypto-native exchange account, and that channel is clearly getting used even during volatility.
Next is Ripple's dollar-pegged stablecoin, RLUSD. Here's the thing: it doesn't compete with XRP head-on. If it expands the payments, liquidity management, and institutional settlement happening on the XRPL, that's more activity running through the same ledger the token sits on. A stablecoin doesn't need XRP's price to climb to be useful, but it does need the ledger to be busy. That's a different kind of value capture than speculative trading, and it may show up in ledger activity before it shows up anywhere else.
Then there's the movement of coins off exchanges. Withdrawals pull tokens away from platforms where they can be sold instantly, which tightens the supply that's immediately available. That matters most if demand picks up, because there's less float to absorb the buying. This is a general pattern, not a guarantee. Coins in self-custody aren't impossible to sell, but they take an extra step to get back to a venue, and that friction changes the math during a rally. A drop in exchange balances can also reflect a holder moving coins for reasons unrelated to price, so treat it as a signal to weigh rather than a verdict.
The reserve figures make the point. Binance's XRP holdings dropped from about 2.69 billion to 2.47 billion between October 28 and October 30, a decline of roughly 220 million tokens in two days. That's the kind of number that deserves a second look. Bybit's fell from 306 million to 286 million tokens, an outflow of 20 million XRP. That move is smaller in absolute terms, but it shows the same pattern at a different scale across platforms. Two days still isn't a trend, so treat these as a snapshot rather than a thesis.
What to Watch Next
The bullish argument comes down to this: long-term holders appear to be absorbing supply, institutional products are pulling in capital, the ledger is seeing more use, and exchanges are holding less XRP. Each piece is modest on its own. Real, but modest. Together they form a pattern that's hard to wave away.
I'd add a caveat, though. "Appear to be" is doing a lot of work in that sentence, because every signal here is an inference from on-chain and reported data rather than direct evidence of intent. The bull case is coherent, and that's not the same as a proven one.
That said, the test is still ahead. Watch whether the $1.20 to $1.25 zone holds and whether wallet growth keeps pace. If both do, the case strengthens. If the price breaks that floor while holder counts stall, the accumulation story loses much of its force. Don't read any single week in isolation. A day or two of inflows could be noise, while a sustained run would mean considerably more.
What This Could Mean Beyond the Chart
If the pattern holds, the more interesting story is about who XRP's holders are becoming. A base of large wallets, fund products, and stablecoin activity on the ledger points to a holder base that looks more like institutions and infrastructure users than a crowd of short-term traders. I'm not convinced that's a price call, and I'd be wary of anyone who treats it as one.
If you're following this space, holder counts and exchange flows are worth tracking alongside price, because they show intent that price alone hides. Keep the same thresholds Santiment uses on your radar, then check whether the signals agree with each other. They often won't, and the disagreement is informative in its own right.
Questions about regulation and the broader market remain open, and this analysis doesn't try to settle them. What the data does show is a divergence, with holders and infrastructure moving one way while price drifts another. Divergences like this eventually resolve, and the resolution tends to clarify which signal was telling the truth.



Discussion
Sign in to join the discussion.